:max_bytes(150000):strip_icc()/dividend-0aad3af67ba54cc98e8fc1ab59346674.jpg)
What is the Dividend Discount Model?
Explained in Detail
The financial theory states that the value of a stock is worth all of the future cash flows expected to be generated by the firm discounted by an appropriate risk-adjusted rate. We can use dividends as a measure of the cash flows returned to the shareholder.
The intrinsic value of the stock is the present value all the future cash flow generated by the stock. For example, if you buy a stock and never intend to sell this stock (infinite time period). What is the future cash flows that you will receive from this stock? Dividends, right?

Here the CF = Dividends.
Dividend discount model prices a stock by adding its future cash flows discounted by the required rate of return that an investor demands for the risk of owning the stock.
However, this situation is a bit theoretical, as investors normally invest in stocks for dividends as well as capital appreciation. Capital appreciation is when you sell the stock at a higher price then you buy for. In such a case, there are two cash flows –
- Future Dividend Payments
- Future Selling Price
Find the present values of these cash flows and add them together :
Formula
Dividend Discount Model = Intrinsic Value = Sum of Present Value of Dividends + Present Value of Stock Sale Price
This Dividend Discount Model or DDM Model price is the intrinsic value of the stock.
If the stock pays no dividends, then the expected future cash flow will be the sale price of the stock. Let us take an example.
Dividend Discount Model Example
In this dividend discount model example, assume that you are considering the purchase of a stock which will pay dividends of $20 (Div 1) next year, and $21.6 (Div 2) the following year. After receiving the second dividend, you plan on selling the stock for $333.3 What is the intrinsic value of this stock if your required return is 15%?
Solution:
This dividend discount model example can be solved in 3 steps –
Step 1 – Find the present value of Dividends for Year 1 and Year 2.
- PV (year 1) = $20/((1.15)^1)
- PV(year 2) = $20/((1.15)^2)
- In this example, they come out to be $17.4 and $16.3 respectively for 1st and 2nd-year dividend.
Step 2 – Find the Present value of future selling price after two years.
- PV(Selling Price) = $333.3 / (1.15^2)
Step 3 – Add the Present Value of Dividends and the present value of Selling Price
- $17.4 + $16.3 + $252.0 = $285.8

Types of Dividend Discount Models
Now that we have understood the very foundation of the Dividend Discount Model, let us move forward and learn about three types of Dividend Discount Models.
- Zero Growth Dividend Discount Model – This model assumes that all the dividends that are paid by the stock remain one and the same forever until infinite.
- Constant Growth Dividend Discount Model – This dividend discount model assumes that dividends grow at a fixed percentage annually. They are not variable and are constant throughout.
- Variable Growth Dividend Discount Model or Non-Constant Growth – This model may divide the growth into two or three phases. The first one will be a fast initial phase, then a slower transition phase a then ultimately ends with a lower rate for the infinite period.
We will discuss each one in greater detail now.
#1 – Zero-growth Dividend Discount Model
The zero-growth model assumes that the dividend always stays the same i.e. there is no growth in dividends. Therefore, the stock price would be equal to the annual dividends divided by the required rate of return.
Stock’s Intrinsic Value = Annual Dividends / Required Rate of Return
This is basically the same formula used to calculate the Present Value of Perpetuity and can be used to price preferred stock, which pays a dividend that is a specified percentage of its par value. A stock based on the zero-growth model can still change in price if the required rate changes when perceived risk changes, for instance.
Zero Growth Dividend Discount Model – Example
If a preferred share of stock pays dividends of $1.80 per year, and the required rate of return for the stock is 8%, then what is its intrinsic value?
Solution:
Here we use the dividend discount model formula for zero growth dividend,
Dividend Discount Model Formula = Intrinsic Value = Annual Dividends / Required Rate of Return
Intrinsic Value = $1.80/0.08 = $22.50.
The shortcoming of the model above is that you’d expect most companies to grow over time.
#2 – Constant-Growth Rate DDM Model
The constant-growth Dividend Discount Model or the Gordon Growth Model assumes that dividends grow by a specific percentage each year,
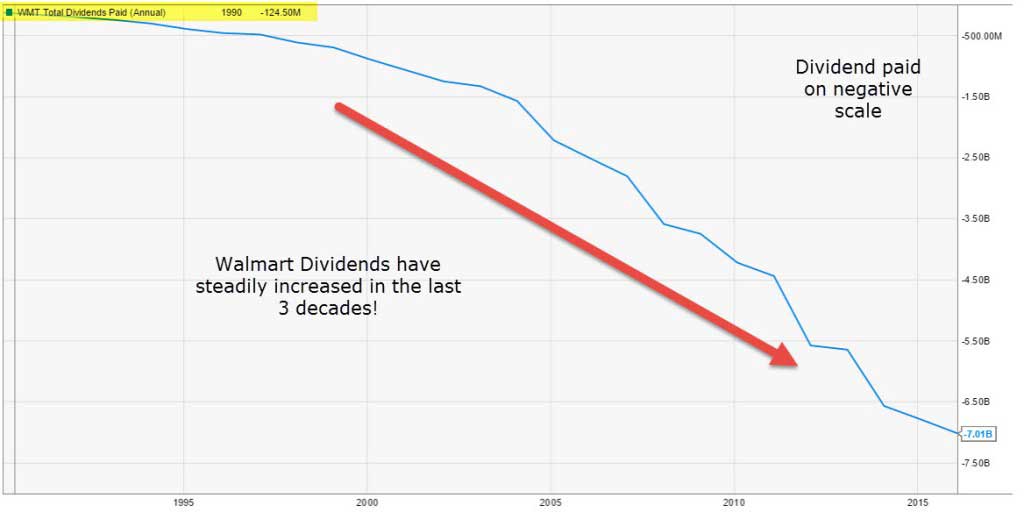
Can you value Google, Amazon, Facebook, Twitter using this method? Of course not as these companies do not give dividends and more importantly are growing at a much faster rate. Constant growth models can be used to value companies that are mature whose dividends increase steadily over the years.
Let us look at Walmart’s Dividends paid in the last 30 years. Walmart is a mature company and we note that the dividends have steadily increased over this period. This company can be a candidate that can be valued using the constant-growth Dividend Discount Model.
Please note that in constant-growth Dividend Discount Model, we do assume that the growth rate in dividends is constant, however, the actual dividends outgo increases each year.
Growth rates in dividends are generally denoted as g, and the required rate is denoted by Ke. Another important assumption that you should note is the required rate or Ke also remains constant every year.
Constant growth Dividend Discount Model or DDM Model gives us the present value of an infinite stream of dividends that are growing at a constant rate.
Constant-growth Dividend Discount Model formula is as per below –
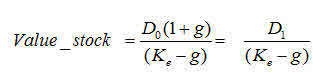
Where:
- D1 = Value of dividend to be received next year
- D0 = Value of dividend received this year
- g = Growth rate of dividend
- Ke = Discount rate
Constant-growth Dividend Discount Model- Example#1
If a stock pays a $4 dividend this year, and the dividend has been growing 6% annually, then what will be the intrinsic value of the stock, assuming a required rate of return of 12%?
Solution:
D1 = $4 x 1.06 = $4.24
Ke = 12%
Growth rate or g = 6%
Intrinsic stock price = $4.24 / (0.12 – 0.06) = $4/0.06 = $70.66
Constant-growth Dividend Discount Model – Example#2
If a stock is selling at $315 and the current dividends is $20. What might the market assume the growth rate of dividends for this stock if the rate of required return is 15%?
Solution:
In this example, we will assume that the market price is the Intrinsic Value = $315
This implies,
$315 = $20 x (1+g) / (0.15 – g)
If we solve the above equation for g, we get the implied growth rate as 8.13%.
#3 – Variable-Growth Rate DDM Model (Multi-stage Dividend Discount Model)
Variable Growth rate Dividend Discount Model or DDM Model is much closer to reality as compared to the other two types of dividend discount model. This model solves the problems related to unsteady dividends by assuming that the company will experience different growth phases.
Variable growth rates can take different forms, you can even assume that the growth rates are different for each year. However, the most common form is one that assumes 3 different rates of growth:
- an initial high rate of growth,
- a transition to slower growth, and
- lastly, a sustainable, steady rate of growth.
Primarily, the constant-growth rate model is extended, with each phase of growth calculated using the constant-growth method, but using different growth rates for the different phases. The present values of each stage are added together to derive the intrinsic value of the stock.
This can be applied as follows:
#3.1 – Two-stage DDM
This model is designed to value the equity in a firm, with two stages of growth, an initial period of higher growth and a subsequent period of stable growth.
Two-stage Dividend Discount Model; best suited for firms paying residual cash in dividends while having moderate growth. For instance, it is more reasonable to assume that a firm growing at 12% in the high growth period will see its growth rate drops to 6% afterwards
Assumptions
- The higher growth rate is expected in the first period.
- This higher growth rate will drop at the end of the first period to a stable growth rate.
- The dividend payout ratio is consistent with the expected growth rate.
# 3.2 – Three stage Dividend Discount Model DDM
One improvement that we can make to the two-stage DDM Model is to allow the growth rate to change slowly rather than instantaneously.
The three-stage Dividend Discount Model or DDM Model is given by:
- First phase: there is a constant dividend growth (g1) or with no dividend
- Second phase: there is a gradual dividend decline to the final level
- The third phase: there is a constant dividend growth again (g3), i.e. the growth company opportunities are over.
The logic that we applied to the two-stage model can be applied to the three-stage model in a similar fashion. Below is the dividend discount model formula for applying three-stage.

My advice would be to not get intimidated by this dividend discount model formulas. Just try and apply the logic that we used in the two-stage dividend discount model. The only change will be that there will one more growth rate between the high growth phase and the stable phase. For this growth rate, you need to find out the respective dividends and their present values.
If you want to find more examples of dividend-paying stocks, you can refer to the Dividend Aristocrat list. This list contains 50 stocks with a dividend-paying history of 25+ years.
Advantages
- Sound Logic – The dividend discount model tries to value the stock based on all the future cash flow profile. Here the future cash flows is nothing but the dividends. In addition, there is very little subjectivity in the mathematical model, and hence, many analysts show faith in this model.
- Mature Business – The regular payment of dividends does imply that the company has matured and there may not be much volatility associated with the growth rates and earnings. This is important for investors who prefer to invest in stocks that pay regular dividends.
- Consistency – Since dividends in most cases are paid by cash, companies tend to keep their dividend payments in sync with the business fundamentals. This implies that companies may not want to manipulate dividend payments as they can directly lead to stock price volatility.
Limitations
Amazon, Google, Biogen are other examples that don’t pay dividends and have given some amazing returns to the shareholders.
- Can only be used to value Mature Companies – This model is efficient in valuing companies that are mature and cannot value high growth companies like Facebook, Twitter, Amazon, and others.
- The sensitivity of Assumptions – As we saw earlier, the fair price is highly sensitive to growth rates and the required rate of return. 1 per cent change in these two can affect the valuation of the company by as much as 10-20%.
- May not be related to earnings – In theory, dividends should be correlated to the earnings of the company. On the contrary, companies, however, try to maintain a stable dividend payout instead of the variable payout based on earnings. In many cases, companies have even borrowed cash to pay dividends.
No comments:
Post a Comment