Tuesday 25 August 2020

Put-Call Parity


Put Call Parity Formula | How to Calculate Put Call Parity?

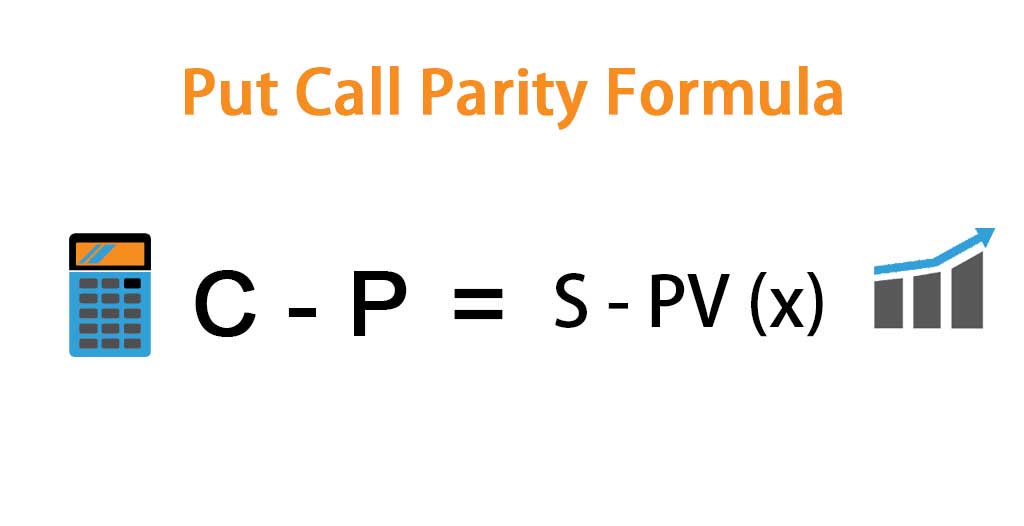
What is Put-Call Parity?

Put-Call parity theorem says that premium (price) of a call option implies a certain fair price for corresponding put options provided the put options have the same strike price, underlying and expiry and vice versa. It also shows the three-sided relationship between a call, a put, and underlying security. The theory was first identified by Hans Stoll in 1969.

Put-Call Parity Example

Let’s take a look at two portfolios of an investor:

Portfolio A: A European call options for a strike price of $500/- which has a premium or price of $80/- and pays no dividend (impact of dividend is discussed later in the paper) and A zero-coupon bond (which pays only principal at the time of maturity) which pays Rs.500/- (or the strike price of call options) at maturity and,

Portfolio B: Underlying stock on which call options are written and a European put options having an identical strike price of $500/- which has a premium of $80/- and an identical expiry.

In order to calculate pay-offs from both the portfolios, let’s consider two scenarios:

  1. Stock price goes up and closes at $600/- at the time of maturity of an options contract,
  2. The stock price has fallen and closes at $400/- at the time of maturity of an options contract. 

Impact on Portfolio A in Scenario 1: Portfolio A will be worth the zero-coupon bond I .e.$500/- plus $100/- from call options pay-off i.e. max(ST-X,0). Therefore, portfolio A will be worth the stock price (ST) at time T.

Impact on Portfolio A in Scenario 2: Portfolio A will be worth the share price i.e. $500/- since the stock price is less than the strike price (it is out of the money), the options will not be exercised. Hence, portfolio A will be worth stock price (ST) at time T.

Likewise, for portfolio B, we will analyze the impact of both scenarios.

Impact on Portfolio B in Scenario 1: Portfolio B will be worth the stock price or share price i.e. $600/- since the share price is lower than the strike price (X) and are worthless to exercise. Therefore, portfolio B will be worth the stock price (ST) at time T.

Impact on Portfolio B in Scenario 2: Portfolio B will be worth the difference between the strike price and stock price i.e. $100/- and underlying share price i.e. $400/-. Hence, portfolio B will be worth a strike price (X) at time T.

The above pay-offs are summarized below in Table 1.

Table: 1

When ST > XWhen ST < X
Portfolio AZero-Coupon bond500500
Call option100*0
Total600500
Portfolio BUnderlying Stock (Share)600400
Put option0100#
Total600500

*The pay-off of a call option = max(ST-X,0)

#The pay-off of a put option = max(X- ST,0)

In the above table we can summarize our findings that when the stock price is more than the strike price (X), the portfolios are worth the stock or share price (ST) and when the stock price is lower than the strike price, the portfolios are worth the strike price (X). In other words, both the portfolios are worth max(ST, X).

Portfolio A: When, S> X, it is worth ST,

Portfolio B: When, S< X, it is worth X

Since, both the portfolios have identical values at time T, they must, therefore, have similar or identical values today (since the options are European, it cannot be exercised prior to time T). And if this is not true an arbitrageur would exploit this arbitrage opportunity by buying the cheaper portfolio and selling the costlier one and book an arbitrage (risk-free) profit.

This brings us to a conclusion that today portfolio A should be equal to Portfolio B. or,

C0+X*e-r*t = P0+S0

Arbitrage Opportunity through Put-Call Parity

Let’s take an example to understand the arbitrage opportunity through put-call parity.

Suppose, the share price of a company is $80/-, the strike price is $100/-, the premium (price) of a six-month call option is $5/- and that of a put option is $3.5/-. The risk-free rate in the economy is 8% per annum.

Now, as per the above equation of put-call parity, the value of the combination of the call option price and the present value of strike would be,

C0+X*e-r*t = 5+100*e-0.08*0.5

= 101.08

And the value of the combination of put option and share price is

P0+S0 = 3.5+80

= 83.5

Here, we can see that the first portfolio is overpriced and can be sold (an arbitrageur can create a short position in this portfolio) and the second portfolio is relatively cheaper and can be bought (arbitrageur can create a long position) by the investor in order to exploit arbitrage opportunity.

This arbitrage opportunity involves buying a put option and a share of the company and selling a call option.

Let’s take this further, by shorting the call option and creating a long position in put option along with share would require below calculated funds to be borrowed by an arbitrageur at risk-free rate i.e.

= -5+3.5+80

= 78.5

Hence, an amount of $78.5 would be borrowed by the arbitrageur and after six months this needs to be repaid. Hence, the repayment amount would be

= 78.5*e0.08*0.5

= 81.70

Also, after six months either the put or call option would be in the money and will be exercised and arbitrageur would get $100/- from this. The short call and long call put option position would, therefore, lead to the stock being sold for $100/-. Hence, the net profit generated by the arbitrageur is

= 100 – 81.70

= $18.30

The above cash flows are summarized in Table 2:

Table: 2

Steps involved in arbitrage positionCost involved
Borrow $78.5 for six months and create a position by selling one call option for $5/- and buying one put option for $3.5/- along with a share for $80/-

i.e. (80+3.5-5)

-81.7
After six months, if the share price is more than the strike price, the call option would be exercised and if it is below the strike price then put option would be exercised100
Net Profit (+) / Net Loss (-)18.3

The Other side of Put-Call parity

Put-Call parity theorem only holds true for European style options as American style options can be exercised at any time prior to its expiry.

The equation which we have studied so far is

C0+X*e-r*t = P0+S0

This equation is also called as Fiduciary Call is equal to Protective Put.

Here, the left side of the equation is called Fiduciary Call because, in fiduciary call strategy, an investor limits its cost associated with exercising the call option (as to the fee for subsequently selling an underlying which has been physically delivered if the call is exercised).

The right side of the equation is called Protective Put because in a protective put strategy an investor is purchasing put option along with a share (P0+S0). In case, share prices go up the investor can still minimize their financial risk by selling shares of the company and protects their portfolio and in case the share prices go down he can close his position by exercising the put option.

For example:-

Suppose strike price is $70/-, Stock price is $50/-, Premium for Put Option is $5/- and that of Call Option is $15/-. And suppose that stock price goes up to $77/-.

In this case, the investor will not exercise its put option as the same is out of the money but will sell its share at the current market price (CMP) and earn the difference between CMP and the initial price of stock i.e. Rs.7/-. Had the investor not been purchased sock along with the put option, he would have been ended up incurring the loss of his premium towards option purchase.

Determining Call options & Put options premium

We can rewrite the above equation in two different ways as mentioned below.

  • P0 = C0+X*e-r*t-S and
  • C0 = P0+S0-X*e-r*t

In this way, we can determine the price of a call option and put option.

For example, let’s assume the price of an XYZ company is trading at Rs.750/- six months call option premium is Rs.15/- for the strike price of Rs.800/-. What would be the premium for put option assuming risk-free rate as 10%?

As per the equation mentioned above in point no 1,

P0 = C0+X*e-r*t-S

= 15+800*e-0.10*0.05-750

= 25.98

Likewise, suppose that in the above example put option premium is given as $50 instead of call option premium and we have to determine call option premium.

C0 = P0+S0-X*e-r*t

= 50+750-800*e-0.10*0.05

= 39.02

Impact of dividends on put-call parity

So far in our studies, we have assumed that there is no dividend paid on the stock. Therefore, the very next thing which we have to take into consideration is the impact of dividend on put-call parity.

Since interest is a cost to an investor who borrows funds to purchase stock and benefit to the investor who shorts the stock or securities by investing the funds.

Here we will examine how the Put-Call parity equation would be adjusted if the stock pays a dividend. Also, we assume that dividend which is paid during the life of the option is known.

Here, the equation would be adjusted with the present value of the dividend. And along with the call option premium, the total amount to be invested by the investor is cash equivalent to the present value of a zero-coupon bond (which is equivalent to the strike price) and the present value of the dividend. Here, we are making an adjustment in the fiduciary call strategy. The adjusted equation would be

C0+(D+X*e-r*t) = P0+ S0  where,

D = Present value of dividends during the life of

Let’s adjust the equation for both the scenarios.

For example, suppose the stock pays $50/- as dividend then, adjusted put option premium would be

P0 = C0+(D+X*e-r*t) – S0

   = 15+(50*e-0.10*0.5+800*e-0.10*0.5)-750

= 73.54

We can adjust the dividends in another way also which will yield the same value. The only basic difference between these two ways is while in the first one we have added the amount of the dividend in strike price, in the other one we have adjusted the dividends amount directly from the stock.

P0 = C0+X*e-r*t– S0-(S0*e-r*t),

In the above formula, we have deducted the amount of the dividend (PV of dividends) directly from the stock price. Let’s look at the calculation through this formula

= 15+800*e-0.10*0.5-750-(50*e-0.10*0.5)

= 73.54

Concluding Remarks

  • Put-Call parity establishes the relationship between the prices of European put options and calls options having the same strike prices, expiry and underlying.
  • Put-Call Parity does not hold true for the American option as an American option can be exercised at any time prior to its expiry.
  • Equation for put-call parity is C0+X*e-r*t = P0+S0.
  • In put-call parity, the Fiduciary Call is equal to Protective Put.
  • Put-Call parity equation can be used to determine the price of European call and put options
  • Put-Call parity equation is adjusted if the stock pays any dividends.

Monday 17 August 2020

PEG Ratio(Price Earning Growth Ratio)

 PEG Ratio Formula | How to Calculate Price Earning Growth?

Price-Earnings Growth (PEG) 

What is PEG Ratio?

Price-Earnings Growth (PEG) ratio is the ratio between price to earnings to the expected growth rate of a company and it helps in describing the earnings and valuations of the company. 

Brief Explanation

The PEG ratio which is also commonly known as Price Earnings to growth ratio is originally a ratio lies within a ratio.  First of all, you required to figure out what is PE ratio for the stock. Once you have this number and information, you’re convenient to compute the overall ratio of P / E to “G.”  “G” which is stands for annual growth of earnings per share. The PEG ratio collates a current share price of a company with its current earnings per share, and after that, it evaluates that PE ratio against the rate at which the firm’s earnings are extending.

  • The price-earnings to growth ratio provide you with a more refined look at a prospective value of investment since an irresistibly high P / E ratio does not inevitably hold up under scrutiny once you take the growth rate of the company into account.
  • The price-earnings to growth ratio can provide you with a picture that how costly or cheap a stock of the company is in relation to the rate at which its earnings are presently rising, and the rate at which they are anticipated to hike over the long-term.
  • This recommends big merit over computing a Price Earning (P / E) ratio of a firm individually since that amount only considers the value of the company in terms of the earnings which is presently generating.
  • A lower-Price Earning Growth ratio usually specifies that business is presently undervalued, based on the performance of its earnings whereas a higher Price Earning Growth ratio generally specifies that business is presently overvalued. It means it states that the to be fairly valued or price PEG ratio required to be equal to
  • It means it states that to be fairly valued or price Price Earning Growth ratio required to be equal to the growth rate of earnings per share or should be one.

PEG Ratio Formula

Formula to calculate the PEG Ratio = Price to earnings (P/E) ratio / Growth rate. Or

Price-Earnings ratio (P/E) ratio / Earnings per share growth rate. 

Importance of Price Earnings Growth

The ratio is generally used to provide an estimate of the fair value of the stock and is provided by different sources of financial and stock data. Some of the PE ratio significance are discussed below:

  • Price Earning Growth is based on the assumption that a PE ratio is positively linearly correlated to the
    the expected growth rate in earnings, i.e. PEG is constant
  • At higher rates of growth, PEG ratios are stable and less sensitive to changes in growth than
    PE ratios, which makes Price Earning Growth ratios more suitable for valuing high-growth companies
  • PEG ratio is used to value growth companies where it is assumed that growth opportunities arise from reinvesting at a premium rate of return or from efficiency gains. 
  • Price Earning Growth ratio is Less appropriate for measuring companies without high growth. Large, well-established Utilities or Infrastructure companies may offer dependable dividend income, but little opportunity for growth. 

Interpretation

“If Price Earnings ratio of any company which is fairly valued will be equal to growth rate”. The following are the interpretation of the Price Earnings Growth ratio.

  • If the PEG ratio is equal to 1, it will be stated that fairly priced or valuation of the business.
  • If the Price Earning Growth ratio is less than 1, it will be stated that undervaluation of the business.
  • If the PEG ratio is more than 1, it will be stated that overvaluation of the business

PEG Ratio Examples, Calculation, and Analysis

The following are some of the examples of Price Earning Growth ratio mentioned below for proper understandings:

Example # 1

Equity shares of the Andy Company are being traded in the market at $ 54 per share with earnings per share of $ 6. The dividend payout of the company is 72 %. It has 1, 00,000 equity shares of $ 10 each and no preference shares. The book value of shares is $ 42. The growth rate of earning per share is 10 %. You are required to calculate the price-earnings to growth (PEG) ratio of Andy Company and analyzed its impact.

The solution to Price Earning Growth Ratio Example # 1.

The following are the necessary calculation and workings mentioned below.

Calculation of Price Earning Growth ratio.

  • Given that, the Market price per share =$ 54 and the Earnings per share (EPS) = $ 6
  • So, Price Earnings (P/E) ratio = Market price per share / Earnings per share = $ 54 / $ 6 = 9
  • So, PEG ratio = P / E ratio / Growth rate of earnings per share = 9 / 10 = 0.9
  • Therefore, the Price Earning Growth ratio of Andy Company is 0.9 and as the PEG ratio is less than its growth rate or one, it will be stated as undervalued. 

Example #

A company has an earning per share of $ 8 and the market value of a share is $ 64 per share. What will be the price-earnings ratio of the company? Calculate the PEG ratio of the company and states its impact if

  • The growth rate of earnings per share will be 10 %
  • The growth rate of earnings per share will be 8 %
  • The growth rate of earnings per share will be 6 %
The solution to PEG Ratio Example # 2

The following are the necessary calculation and workings mentioned below.

Calculation of Price-earnings ratio

  • Given that, Market price per share = $64 and Earnings per share = $8,
  • So, PE ratio = Market price per share / Earnings per share
  • PE Ratio = $ 64 / $ 8 = 8.0x

Calculation of Price Earning Growth ratio in case of the growth rate of earnings is 10 %

  • Price Earning Growth ratio = P / E ratio / Growth rate of earnings = 8 / 10 = 0.8
  • As the Price Earning Growth ratio is less than one, it is stated as undervalued.

Calculation of Price Earning Growth ratio in case of a growth rate of earnings is 8 %

  • Price Earning Growth ratio = P / E ratio / Growth rate of earnings = 8 / 8 = 1
  • As the PEG ratio is equal to one, it is stated as fairly priced.

Calculation of Price Earning Growth ratio in case of the growth rate of earnings is 6 %

  • PEG ratio = P / E ratio / Growth rate of earnings = 8 / 6 = 1.33
  • As the Price Earning Growth ratio is more than one, it is stated as overvalued

Example # 3

A company ABC Limited is capitalized as follows: (Amount in $)

ParticularsAmount
7 % Preference shares, $ 1 each60,000
Ordinary shares, $ 1 each1,60,000

The following are the information is relevant as to its financial year just ended: (Amount in $)

ParticularsAmount
Profit after taxation at 50 %54,200
Capital commitments24,000
The market price of ordinary shares$ 4 per shares
Ordinary dividends paid20 %
Depreciation12,000
The growth rate of earnings per share11 %

You are required to state the following showing the necessary workings:

  • Price-earnings (P / E) ratio
  • Price-earnings to growth ratio (PEG) ratio and its impact
The solution to Price Earning Growth Ratio Example # 3

The following are the necessary calculation and workings mentioned below.

Calculation of Earnings per share (EPS)

  • Before calculating the Earning per share we need to calculate the Profit after tax available to Ordinary or equity shareholders
  • So, Profit after tax available to ordinary shareholders
  • = Profit after tax – Preference dividends = 54,200 – (7 % of 60,000) = 54,200 – (7 * 600) = 54,200 – 4,200 = 50,000
  • So, Earnings per share = Profit after tax available to ordinary shareholders / Number of ordinary shares = 50,000 / 1, 60,000 = 5 / 16 = 0.3125. Therefore the EPS is 0.3125

Calculation of PE ratio

  • Given, Market price of ordinary share = 4 per share
  • Earnings per share (Calculated above) = 0.3125
  • Price earnings ratio = Market price of ordinary shares / Earnings per share = 4 / 0.3125 = 40,000 / 3125 = 12.8. Therefore the Price earnings ratio is 12.8

Calculation of Price earnings to growth (PEG) ratio

  • Given, Price earnings ratio [As calculated above in point no. (ii)] = 12.8
  • Growth rate of earnings per share = 11 %
  • So, Price Earning Growth ratio = Price-earnings ratio / Growth rate of earnings per share = 12.8 / 11 = 1.164 (Approx)
  • Therefore the PEG ratio is 1.164 and as the Price Earning Growth ratio is more than one it will be stated as overvalued. 

Example # 4

A company Mark Limited has the following relevant information for the financial year ended as on 31st March 2020. (Amount in $)

ParticularsAmount
Equity  share capital ( $ 20 each )5,00,000
Reserve and surplus50,000
Secured loans at 15 %2,50,000
Unsecured Loans at 12.5 %1,00,000
Fixed assets3,00,000
Investments50,000
Operating profit2,50,000
Income tax rate50 %
Market price per share$ 50 per share
The growth rate of earnings per share8 %

You are required to calculate the following showing the necessary workings:

  • Price-earnings ratio.
  • PEG ratio and its impact.
  • Analyze the require a growth rate of earnings per share to make the PEG ratio fairly priced.
The solution to PEG Ratio Example # 4

The following are the necessary calculation and workings of mentioned below.

Calculation of profit after tax. ( Amount in $ )

ParticularsAmount
Operating Profit  (a)2,50,000
Less: Interest on Loans (b)
         I.            Interest on secured loans @ 15 % = 2,50,000 * 15 / 100 = 37,500
        II.            Interest on unsecured loans @ 12.5 % = 1,00,000 * 12.5 / 100 = 12,500
 Total Interest (I + II )50,000
Profit before tax (PBT) = ( a – b )2,00,000
Less income tax @ 50 % = 2,00,000 * 50 / 1001,00,000
Profit after tax (PAT) = PBT – Income tax1,00,000

Calculation of Earnings per share

  • Given, Number of equity shares = Total Equity share capital / Rate per share = 5, 00,000 / 20 = 25,000
  • Profit after tax (As calculated above in point no. i) = 1, 00,000
  • So, Earnings per share (EPS) = Profit after tax / Number of equity shares = 1, 00, 000 / 25,000 = 4
  • Therefore the Earnings per share of Mark limited is $ 4 per share.

Calculation of Price-earnings ratio

  • Given that, Earning per share (as calculated above) = $ 4
  • And the Market price per share = $ 50
  • As we know Price-earnings (P / E) ratio = Market price per share / Earnings per share. So, Price-earnings ratio = $ 50 / $ 4 = 12.50
  • Therefore, the price-earnings ratio of Mark limited is 12.50

Calculation of Price Earning Growth ratio

  • Given that, Price-earnings ratio (as calculated above) = 12.50
  • And the Growth rate of earnings per share = 8 %
  • So, Price Earning Growth ratio = Price earning ratio / Growth rate of earnings per share = 12.5 / 8 = 1.5625 = 1.56 (App.)
  • Therefore, the Price Earning Growth ratio of Mark limited is 1.56 and as the PEG ratio is more than one it will be stated as overvalued.

Calculation of Growth rate of earnings per share for a fairly priced Price Earning Growth ratio.

  • Given that, Price earning ratio (as calculated above in point no. iii) = 12.50
  • As it is already stated that the PEG ratio should be fairly priced, so the PEG ratio should be taken as 1.
  • We know that the PEG ratio = Price earning ratio / Growth rate of earnings per share
  • So, PEG ratio = 12.50 / Growth rate of earnings per share = Growth rate of earnings per share = 12.50 /Price Earning Growth ratio = Growth rate of earnings per share = 12.50 / 1 = 12.50
  • Therefore, to need a fairly priced Price Earning Growth ratio, the growth rate of earnings per share will be 12.50 %