Monday 21 September 2020

Growth Capital in Detailed


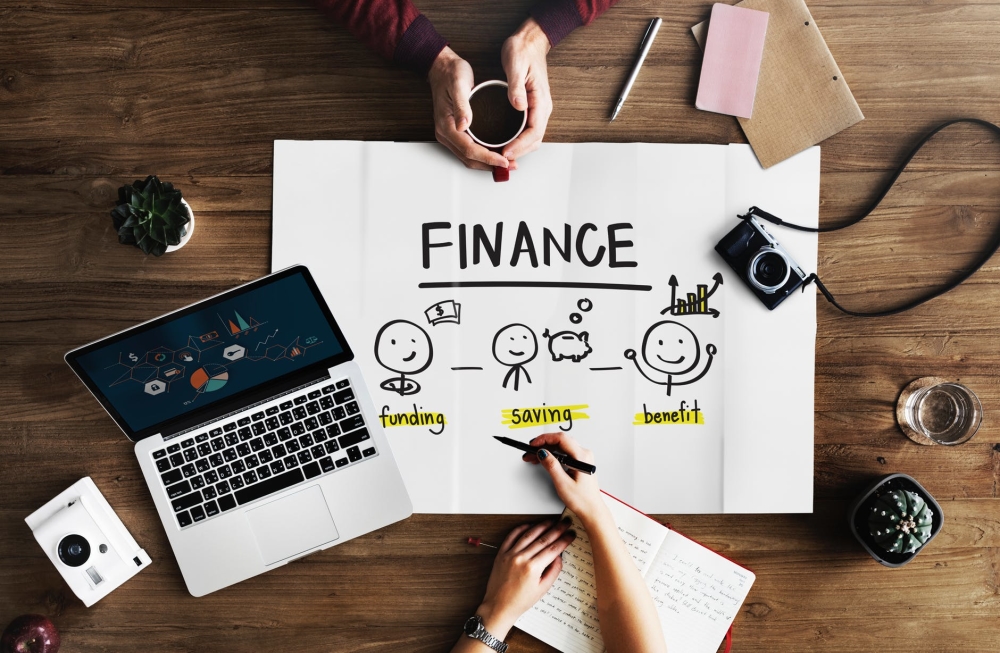
Growth Capital Meaning

Growth capital popularly known as expansion capital is capital provided to relatively mature companies that require money to expand or restructure operations or explore and enter new markets. So basically growth capital serves the purpose of facilitating target companies to accelerate growth.

Growth capital is placed on the gamut of private equity investing at the crossroads of venture capital and control buyouts.

In this article, we look at what is Growth Capital in detail –

  • What a PE fund looks out for when doing Growth Capital investment?
  • Growth Capital Deals Example
    • #1 – Softbank investment in Uber Rival Grab – $750 mn
    • #2 – Airbnb raises $447.8mn in series F round of funding
    • #3 – Deliveroo raised $275 mn in round 5 funding
    • #4 – In context Solutions raises $15.2 mn from Beringea.
  • Minority Interests and Growth Capital
  • Majority Interests and Growth Capital
  • Growth Capital deal characteristics
  • Structuring a Growth capital investment
  • Growth Capital vs Venture Capital
  • Growth Capital vs Controlled Buy-outs
  • Conclusion

What a PE fund looks out for when doing Growth Capital investment?

When it comes to Growth capital these investments provide a different set of opportunities and challenges to PE investors. Not all PE investors would be interested, nor are they active in this area. Few of them are not permitted to invest and provide growth capital based on their fund documentation.

Why so? This is because PE funds would generally not be interested in opportunities that result in cash burn rate in the foreseeable future. This is so as the investors would have little appetite to fund working capital or cash requirements as an ongoing responsibility or to invest where there is a risk of future dilution.

When a PE fund wishes to do a growth capital investment they would be looking out for a concrete clear plan outlining the capital requirements. Although the requirements would be significantly huge but would be limited and specific such as generating substantial EBITDA growth, international expansion, etc.

Growth Capital Deals Examples

Let’s discuss the following examples.

Growth Capital Deals Examples

#1 – Softbank investment in Uber Rival Grab – $750 mn

Softbank making an investment in Uber rival Grab in 2016 of $750 mn was a growth capital investment. This was Series F round of investment and was led by Softbank along with other investors. Currently, Grab operates in six countries in South Asia and has 400,000 drivers on its platform with 21 million downloads for its app. The capital was required to compete in an efficient way with Uber and others particularly in Indonesia and to focus on technology. Grab plans to refine its algorithms so as to help its drivers to be more efficient, build mapping data and technology and also work on demand prediction and user targeting.

#2 – Airbnb raises $447.8mn in series F round of funding

Airbnb was able to raise $447.8mn in series F round of funding. Airbnb has in past expanded in the travel sector by launching Trips, which offer customers tours and related activities. It plans to add flights and services in the future.

#3 – Deliveroo raised $275 mn in round 5 funding

Food delivery service Deliveroo raised $275 mn in round 5 funding. This London based company is active in 12 countries in Europe, Asia, and the Middle East. This financing was led by experienced restaurant investor Bridgepoint along with existing investor Greenoaks Capital. The funds were procured for geographic expansion in new and existing markets as well as further investments in projects such as Roo-Box, which would give restaurants access to off-site kitchen space that will cater to the takeaway demand that cannot be supplied by their own restaurant kitchens.


#4 – In context Solutions raises $15.2 mn from Beringea.

In context Solutions successfully got $15.2 mn through Beringea. Beringea is a PE firm that is focused on providing growth capital. In-context Solutions is a global leader in virtual reality (VR) solutions for retailers and manufacturers. This capital would be utilized to accelerate sales, marketing efforts and expand its geographic footprint. It will also focus on improving VR product portfolio, and also include further development of solutions for head-mounted devices Of the total investment deals done in 2016 2% were for Growth capital/ Expansion as per pre in.


Minority Interests and Growth Capital

Growth investments would ideally take the form of significant minority interest. Compared to the traditional buy-out or traditional VC investment there is no single form of document that is used in such deals.

So what happens is that while some deals would be quite similar to late-stage VC investment other would have similar characteristics as that of a typical buyout. This would depend on the negotiation among the parties. This would also depend on PE investor’s earlier experience on growth capital and have a minority interest. As many investors are unaware of the dynamics of controlling interest so they would seek contractual rights else they would rely on their relationship with the management and forego their protective rights.

If the investors go for control rights then the investors would have these rights accompanied by the power to intervene when things go wrong or force an exit if the same doesn’t occur in the agreed investment window say for example 3 years from the initial investment. This scenario may cause friction especially if the founder is successful and has developed business at an early stage.

When an investor goes for growth capital then it is important that clarity is maintained on such matters. Clarity should be maintained on what would be the steps to be taken if there is friction among investors and founders or when the founder ceases to be involved in the business on an active basis. The key area of the debate would be transferring shares that are founder’s equity and ongoing shareholder protection and board rights of the founder when he decides to go in passive mode.

Majority Interests and Growth Capital

Sometimes there would be Majority Interest in the deal given to PE investor. However, this happens rarely. If this happens then the contract and investment would resemble classic buyout. There would be few differences around the operational features and capabilities of the company.

Compared to a mature buyout, most of the target companies wouldn’t be ready for the requirements of PE investors. It is quite unlikely of shareholder debt being re-payed during earlier years of investment. This would result in loan note-getting compounded. Also, these target companies wouldn’t have the right infrastructure to provide the requisite financial reporting to PE investors. Failure to comply with provisions of providing requisite financial information can lead to operational and economic consequences. In such a scenario, it is necessary that the agreements are drafted in such a manner that target companies have the time to develop the systems required for reporting.

Issues such as no HR policies in place, lack of health and safety compliance, data protection policies need to be in place when a PE investor would step in and invest. These issues would not break the deal between the two parties but would require operational change.

Any investor is looking out for profitable investments. PE investors would be interested in growth capital investments if the business has the potential and the investment is done at the crucial point of the growth curve of Target Company. Also, management of the finances is of utmost necessity for making the investments profitable.

Apart from financial performance, it will be necessary that issues such as those mentioned above are sorted so as to ensure that PE investor makes a successful exit, as a successful business is easy to sell or attractive enough to be introduced to public markets.

Growth Capital deal characteristics

Each deal would have specific terms. These terms would be decided on the basis of several key metrics such as past financial performance, operating history so far, market cap etc. However, these terms would be similar to the traditional deal made for late-stage venture capital financing.

The key characteristics would be -:

  1. Just like a deal with a venture capitalist, even in Growth Capital, the investor would acquire preferred security in the target company.
  2. These would be a minority stake using little leverage.
  3. The deal would give redemption rights that are designed to create liquidity on triggering events such as IPO
  4. The deal would be designed to give operational control over significant matters. These provisions give investors consent rights on the important transaction such as any debt or equity transactions, transactions relating to M&A, any change in tax/accounting policies, any deviations from budget/business plan, changes in key management personnel that hiring/firing, and other significant operational activities.
  5. The growth capital deal gives the investor rights such as tag-along rights, drag-along rights, and registration rights. These rights are given as deemed appropriate for the size and scope of the transaction and the lifecycle of the issue.

Structuring a Growth capital investment

The trend in the market is that companies adopt private equity-style structures so as to secure key assets in the growth of capital space. These would be those assets which are essentials from an investor perspective and have the potential growth potential that he or she wants to deliver and earn the benefit of through retained share ownership. Hence growth capital investment would have many of the features of a secondary buyout, including from a commercial, legal and tax perspective.

Growth Capital vs Venture Capital

From the private equity investor’s perspective, there are several key distinctions between growth capital and venture capital These are -:

  1. Growth capital focuses on investing in mature companies whereas a VC would focus on early-stage companies who have an unproven business model.
  2. In the case of venture capital, investments are done in multiple early-stage companies of a specific industry or sector. However, Growth capital investment would do in a market leader or a perceived market leader within a specific industry or sector
  3. The investment theses in venture capital are underwritten on substantial growth projections of revenue of Target Company. However, when it comes to growth capital investment the investment logic is on the definite plan to achieve profitability potential.
  4. In Venture capital investments the future capital requirements are undefined. However, this would not be the case in growth capital investments that Target companies would have no or minimum future capital requirements.

Also, have a look at the difference between Private Equity vs Venture Capital.

Growth Capital vs Controlled Buy-outs

When it comes to growth capital it differs in several manners such as -:

  1. In control buyouts, the investment is a controlling equity position, whereas in Growth capital this is not the case.
  2. PE investors invest in highly profitable operating companies in controlled buy-outs. These are those companies that have free cash flow. However, growth capital investments are done in those companies that have limited or no Free Cash Flow
  3. Often in controlled buyouts debt financing is employed to leverage the investment. However, in growth capital investments the companies have no or minimum funded debt.
  4. An investment in controlled buy-outs is done at a point where there is growth stability that is projections point towards stable revenue & profitability. However, as mentioned above growth capital investments are done at a junction where the investment made will boost revenue and profitability of the target company.

Conclusion

Growth capital is lesser-known investing as compared to traditional venture capital and controlled buyout. However, it represents a low-risk cost of capital for the investor as compared to traditional private equity investments. Target companies, in turn, get the benefit of an attractive source of financing that helps them to accelerate their revenue and profitability growth.

Wednesday 9 September 2020

Financial Functions in Excel With Example

 How can financial services organisations grow their customer base?


Top 15 Financial Functions in Excel

Microsoft Excel is the most important tool of  Investment Bankers and Financial Analysts. They spent more than 70% of the time preparing Excel Models, formulating Assumptions, Valuations, Calculations, Graphs, etc. It is safe to assume that Investment bankers are masters in excel shortcuts and formulas. Though there are more than 50+ Financial Functions in Excel, here is the list of Top 15 financial functions in excel that are most frequently used in practical situations.

Without much ado, let’s have a look at all the financial functions one by one –

  • #1 – Future Value (FV)
  • #2 – FVSCHEDULE
  • #3 – Present Value (PV)
  • #4 – Net Present Value (NPV)
  • #5 – XNPV
  • #6 – PMT
  • #7 – PPMT
  • #8 – Internal Rate of Return (IRR)
  • #9 – Modified Internal Rate of Return (MIRR)
  • #10 – XIRR
  • #11 – NPER
  • #12 – RATE
  • #13 – EFFECT
  • #14 – NOMINAL
  • #15 – SLN

#1 – Future Value (FV): Financial Function in Excel 

If you want to find out the future value of a particular investment which has a constant interest rate and periodic payment, use the following formula –

Future Value - Financial Functions in Excel

FV (Rate, Nper, [Pmt], PV, [Type])

  • Rate = It is the interest rate/period
  • Nper = Number of periods
  • [Pmt] = Payment/period
  • PV = Present Value
  • [Type] = When the payment is made (if nothing is mentioned, it’s assumed that the payment has been made at the end of the period)

FV Example

A has invested the US $100 in 2017. The payment has been made yearly. The interest rate is 10% p.a. What would be the FV in 2020?

Solution: In excel, we will put the equation as follows –

Future Value - Financial Functions in Excel - Example

= FV (10%, 3, 1, – 100)

= US $129.79

#2 – FVSCHEDULE: Financial Function in Excel 

This financial function is important when you need to calculate the future value with the variable interest rate. Have a look at the function below –

FVSCHEDULE - Financial Functions in Excel

FVSCHEDULE = (Principal, Schedule)

  • Principal = Principal is the present value of a particular investment
  • Schedule = A series of interest rate put together (in case of excel, we will use different boxes and select the range)

FVSCHEDULE Example:

M has invested the US $100 at the end of 2017. It is expected that the interest rate will change every year. In 2018, 2019 & 2020, the interest rates would be 4%, 6% & 5% respectively. What would be the FV in 2020?

Solution: In excel, we will do the following –

FVSCHEDULE - Financial Functions in Excel - Example

= FVSCHEDULE (C1, C2: C4)

= US $115.752

#3 – Present Value (PV): Financial Function in Excel 

If you know how to calculate FV, it’s easier for you to find out PV. Here’s how –

PV - Financial Functions in Excel

PV = (Rate, Nper, [Pmt], FV, [Type])

  • Rate = It is the interest rate/period
  • Nper = Number of periods
  • [Pmt] = Payment/period
  • FV = Future Value
  • [Type] = When the payment is made (if nothing is mentioned, it’s assumed that the payment has been made at the end of the period)

PV Example:

The future value of an investment in the US $100 in 2020. The payment has been made yearly. The interest rate is 10% p.a. What would be the PV as of now?

Solution: In excel, we will put the equation as follows –

PV - Financial Functions in Excel - Example

= PV (10%, 3, 1, – 100)

= US $72.64

#4 – Net Present Value (NPV): Financial Function in Excel 

Net Present Value is the sum total of positive and negative cash flows over the years. Here’s how we will represent it in excel –

NPV - Financial Functions in Excel

NPV = (Rate, Value 1, [Value 2], [Value 3]…)

  • Rate = Discount rate for a period
  • Value 1, [Value 2], [Value 3]… = Positive or negative cash flows
  • Here, negative values would be considered as payments and positive values would be treated as inflows.

NPV Example

Here is a series of data from which we need to find NPV –

DetailsIn US $
Rate of Discount5%
Initial Investment-1000
Return from 1st year300
Return from 2nd year400
Return from 3rd year400
Return from 4th year300

Find out the NPV.

Solution: In Excel, we will do the following –

NPV - Financial Functions in Excel - Example

=NPV (5%, B4:B7) + B3

= US $240.87

Also, have a look at this article – NPV vs IRR

#5 – XNPV: Financial Function in Excel 

This financial function is similar as the NPV with a twist. Here the payment and income are not periodic. Rather specific dates are mentioned for each payment and income. Here’s how we will calculate it –

XNPV - Financial Functions in Excel

XNPV = (Rate, Values, Dates)

  • Rate = Discount rate for a period
  • Values = Positive or negative cash flows (an array of values)
  • Dates = Specific dates (an array of dates)

XNPV Example

Here is a series of data from which we need to find NPV –

DetailsIn US $Dates
Rate of Discount5%
Initial Investment-10001st December 2011
Return from 1st year3001st January 2012
Return from 2nd year4001st February 2013
Return from 3rd year4001st March 2014
Return from 4th year3001st April 2015

Solution: In excel, we will do as follows –

XNPV - Financial Functions in Excel - Example

=XNPV (5%, B2:B6, C2:C6)

= US$289.90

#6 – PMT: Financial Function in Excel 

In excel, PMT denotes the periodical payment required to pay off for a particular period of time with a constant interest rate. Let’s have a look at how to calculate it in excel –

PMT - Financial Functions in Excel

PMT = (Rate, Nper, PV, [FV], [Type])

  • Rate = It is the interest rate/period
  • Nper = Number of periods
  • PV = Present Value
  • [FV] = An optional argument which is about the future value of a loan (if nothing is mentioned, FV is considered as “0”)
  • [Type] = When the payment is made (if nothing is mentioned, it’s assumed that the payment has been made at the end of the period)

PMT Example

US $1000 needs to be paid in full in 3 years. The interest rate is 10% p.a. and the payment needs to be done yearly. Find out the PMT.

Solution: In excel, we will calculate it in the following manner –

PMT - Financial Functions in Excel Example

= PMT (10%, 3, 1000)

= – 402.11

#7 – PPMT: Financial Function in Excel 

It is another version of PMT. The only difference is this – PPMT calculates payment on principal with a constant interest rate and constant periodic payments. Here’s how to calculate PPMT –

PPMT - Financial Functions in Excel

PPMT = (Rate, Per, Nper, PV, [FV], [Type])

  • Rate = It is the interest rate/period
  • Per = The period for which the principal is to be calculated
  • Nper = Number of periods
  • PV = Present Value
  • [FV] = An optional argument which is about the future value of a loan (if nothing is mentioned, FV is considered as “0”)
  • [Type] = When the payment is made (if nothing is mentioned, it’s assumed that the payment has been made at the end of the period)

PPMT Example

US $1000 needs to be paid in full in 3 years. The interest rate is 10% p.a. and the payment needs to be done yearly. Find out the PPMT in the first year and second year.

Solution: In excel, we will calculate it in the following manner –

1st year,

PPMT - Financial Functions in Excel Example 1

=PPMT (10%, 1, 3, 1000)

= US $-302.11 

2nd year,

PPMT - Financial Functions in Excel Example 2

=PPMT (10%, 2, 3, 1000)

= US $-332.33

#8 – Internal Rate of Return (IRR): Financial Function in Excel 

To understand whether any new project or investment is profitable or not, the firm uses IRR. If IRR is more than the hurdle rate (acceptable rate/ average cost of capital), then it’s profitable for the firm and vice-versa. Let’s have a look, how we find out IRR in excel –

IRR - Financial Functions in Excel

IRR = (Values, [Guess])

  • Values = Positive or negative cash flows (an array of values)
  • [Guess] = An assumption of what you think IRR should be

IRR Example

Here is a series of data from which we need to find IRR –

DetailsIn US $
Initial Investment-1000
Return from 1st year300
Return from 2nd year400
Return from 3rd year400
Return from 4th year300

Find out IRR.

Solution: Here’s how we will calculate IRR in excel –

IRR - Financial Functions in Excel Example

= IRR (A2:A6, 0.1)

= 15%

#9 – Modified Internal Rate of Return (MIRR): Financial Function in Excel 

Modified Internal Rate of Return is one step ahead of the Internal Rate of Return. MIRR signifies that the investment is profitable and is used in business. MIRR is calculated by assuming NPV as zero. Here’s how to calculate MIRR in excel –

MIRR - Financial Functions in Excel

MIRR = (Values, Finance rate, Reinvestment rate)

  • Values = Positive or negative cash flows (an array of values)
  • Finance rate = Interest rate paid for the money used in cash flows
  • Reinvestment rate = Interest rate paid for reinvestment of cash flows

MIRR Example

Here is a series of data from which we need to find MIRR –

DetailsIn US $
Initial Investment-1000
Return from 1st year300
Return from 2nd year400
Return from 3rd year400
Return from 4th year300

Finance rate = 12%; Reinvestment rate = 10%. Find out IRR.

Solution: Let’s look at the calculation of MIRR –

= MIRR (B2:B6, 12%, 10%)

= 13%

MIRR - Financial Functions in Excel Example

#10 – XIRR: Financial Function in Excel 

Here we need to find out IRR which has specific dates of cash flow. That’s the only difference between IRR and XIRR. Have a look at how to calculate XIRR in excel financial function –

XIRR - Financial Functions in Excel

XIRR = (Values, Dates, [Guess])

  • Values = Positive or negative cash flows (an array of values)
  • Dates = Specific dates (an array of dates)
  • [Guess] = An assumption of what you think IRR should be

XIRR Example

Here is a series of data from which we need to find XIRR –

DetailsIn US $Dates
Initial Investment-10001st December 2011
Return from 1st year3001st January 2012
Return from 2nd year4001st February 2013
Return from 3rd year4001st March 2014
Return from 4th year3001st April 2015

Solution: Let’s have a look at the solution –

XIRR - Financial Functions in Excel Example

= XIRR (B2:B6, C2:C6, 0.1)

= 24%

#11 – NPER: Financial Function in Excel 

It is simply the number of periods one requires to pay off the loan. Let’s see how we can calculate NPER in excel –

NPER - Financial Functions in Excel

NPER = (Rate, PMT, PV, [FV], [Type])

  • Rate = It is the interest rate/period
  • PMT = Amount paid per period
  • PV = Present Value
  • [FV] = An optional argument which is about the future value of a loan (if nothing is mentioned, FV is considered as “0”)
  • [Type] = When the payment is made (if nothing is mentioned, it’s assumed that the payment has been made at the end of the period)

NPER Example

US $200 is paid per year for a loan of US $1000. The interest rate is 10% p.a. and the payment needs to be done yearly. Find out the NPER.

Solution: We need to calculate NPER in the following manner –

NPER - Financial Functions in Excel Example

= NPER (10%, -200, 1000)

= 7.27 years

#12 – RATE: Financial Function in Excel 

Through the RATE function in excel, we can calculate the interest rate needed to pay off the loan in full for a given period of time. Let’s have a look at how to calculate RATE financial function in excel –

RATE - Financial Functions in Excel

RATE = (NPER, PMT, PV, [FV], [Type], [Guess])

  • Nper = Number of periods
  • PMT = Amount paid per period
  • PV = Present Value
  • [FV] = An optional argument which is about the future value of a loan (if nothing is mentioned, FV is considered as “0”)
  • [Type] = When the payment is made (if nothing is mentioned, it’s assumed that the payment has been made at the end of the period)
  • [Guess] = An assumption of what you think RATE should be

RATE Example

US $200 is paid per year for a loan of US $1000 for 6 years and the payment needs to be done yearly. Find out the RATE.

Solution:

RATE - Financial Functions in Excel Example

= RATE (6, -200, 1000, 0.1)

= 5%

#13 – EFFECT: Financial Function in Excel 

Through the EFFECT function, we can understand the effective annual interest rate. When we have the nominal interest rate and the number of compounding per year, it becomes easy to find out the effective rate. Let’s have a look at how to calculate EFFECT financial function in excel –

EFFECT - Financial Functions in Excel

EFFECT = (Nominal_Rate, NPERY)

  • Nominal_Rate = Nominal Interest Rate
  • NPERY = Number of compounding per year

EFFECT Example

Payment needs to be paid with a nominal interest rate of 12% when the number of compounding per year is 12.

Solution:

EFFECT - Financial Functions in Excel Example

= EFFECT (12%, 12)

= 12.68%

#14 – NOMINAL: Financial Function in Excel 

When we have an effective annual rate and the number of compounding periods per year, we can calculate the NOMINAL rate for the year. Let’s have a look at how to do it in excel –

Nominal - Financial Functions in Excel

NOMINAL = (Effect_Rate, NPERY)

  • Effect_Rate = Effective annual interest rate
  • NPERY = Number of compounding per year

NOMINAL Example

Payment needs to be paid with an effective interest rate or annual equivalent rate of 12% when the number of compounding per year is 12.

Solution:

Nominal - Financial Functions in Excel Example

= NOMINAL (12%, 12)

= 11.39%

#15 – SLN: Financial Function in Excel 

Through the SLN function, we can calculate depreciation via a straight-line method. In excel, we will look at SLN financial function as follows –

SLN - Financial Functions in Excel

SLN = (Cost, Salvage, Life)

  • Cost = Cost of asset when bought (initial amount)
  • Salvage = Value of asset after depreciation
  • Life = Number of periods over which the asset is being depreciated

SLN Example

The initial cost of machinery is the US $5000. It has been depreciated in the Straight Line Method. The machinery was used for 10 years and now the salvage value of machinery is the US $300. Find depreciation charged per year.

Solution:

SLN - Financial Functions in Excel Example

= SLN (5000, 300, 10)

= US $470 per year